Sunday, December 20, 2009
Your instruments
Go to Flutomat to calculate the length of your pipes in centimeters
I need a reflection that details...
How many notes are in your instrument
A picture of your instrument
The materials you are using (size and material)
Your song
Your partners
Your notes (e.g., C4, D3, etc.)
Your frequencies (261.31 Hz, etc)
Your wavelengths (.8 m, etc.)
The lengths of your note pipes or strings
What are the strengths in your insttruments? What could make your instrument better?
Friday, December 11, 2009
Friday, 12/11/09

Please sit in your assigned seats. Elizabeth or Kelly will take attendance. Krista or Elizabeth can get materials as needed from the supply cabinet during Block 1.
You will be focused on Activity 4 on pp 334. Each person will be given a maximum of 4 straws for this entire activity, so do not chew on them ;)
Take a look at the picture on p. 334. Write down 5 observations about how the sound is being produced in your notebook, and the differences among the musician's instruments. Discuss these as a class.
On p. 335, complete steps 1, 2, and 3. This should take about 5 or 10 minutes. Can you modify your instrument to make a recognizable tune? Take 5 or 10 minutes and give it a try. What difference do you notice between a closed tube and an open tube (your finger on the bottom vs. your finger away from the bottom of the straw)
As a class, watch the following:
AS a table, do a THOUGHT experiment for 4. and 5. on pp. 355 Use the video as your evidence. Watching the vids and discussion should take about 10 minutes.
Next, read p. 357-358 out loud with one partner. Pay careful attention to the diagrams. This should take about 10 minutes.
Make a reed instrument as shown on p. 358. Use a piece of paper and tape to make an extension tube. What is the purpose of the wider tube at the bottom?
Physics to Go p. 359
1, 2a, 2b, 6, 7 Stretch 4, and, if there is time, try #5 in the new gym (have Krista or Kelly check to see if it is empty first.)
Monday, December 7, 2009
Wednesday, December 2, 2009
Thursday and Friday
THURSDAY
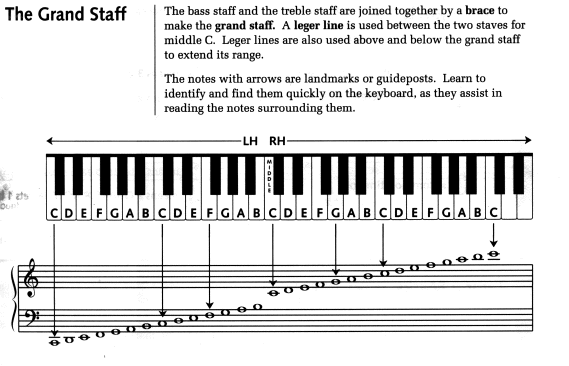
You will be showing me your ability to use the properties of fishing line as a musical instrument. Yeah for you! Your job is to play a piece of music from 8notes.com using at least 5 different notes. If you do not know how to read music, you may have to go to http://www.harpinanawhinin.com/IMAGES/grand_staff.gif to find out the notes. You can play the music using the virtual keyboard, if you wish.
Grading: Your musical masterpiece will be graded as follows:
Using at least 5 different strings: 4
Involving all group members: 3
Quality of sound (is it recognizable?): 5
Behavior while other groups are performing : 4
Involving all group members: 3
Quality of sound (is it recognizable?): 5
Behavior while other groups are performing : 4
FRIDAY
Today you will be going to PHET to play with a ripple tank, a device to observe waves. Copy the directions for Activity 1 and Activity 2 into an email window. Email to me at marciarpowell@gmail.com. Answer in groups of 2-3. GROUPS larger than 3 people WILL NOT receive points unless I have a note from the substitute teacher.
Activity 1:
A. Water Wave Simulator
First you are going to record your observations about the water wave simulator.
- What happens to what you see as you move the frequency and amplitude sliders?
- Now click Show graph and repeat. What do you notice with the graph of the water level? (Use terms like amplitude, crest, trough, wavelength, and frequency)
- Now rotate your view of the water. Record your observations.
- What happens if you add a second drip? What happens if you space them close together? Far apart?
- Turn off the second drip but add a barrier. Record your observations. What happens as you alter the width of the slit?
B. Sound Wave Simulator
Now click on the top tab that says sound.
- What do you see?
- What happens when you press the particle button? What happens to the particles as you alter the frequency and amplitude? Record your observations.
- Click show graph. What happens to the graph as frequency and amplitude are changed?
- Click on grayscale. What happens when you rotate the view? Record your observations.
- What happens when you turn the speaker off?
- Turn the speaker back on after all the particles become still.
- Turn on the sound. What happens to the sound as you vary the frequency and amplitude?
- Put the sliders for frequency and amplitude in the middle. What happens if you add a barrier? What if you alter the barrier? What if you add two?
- Light Wave Simulator
Now click the top tab that says “light”
- Click “show graph” and “add detector”
- What happens when you vary the amplitude? What happens if you put the amplitude at 0?
- What happens to the wavelength and frequency as you change the color?
- What can you say about the difference in colors?
- Now add a slit. Move the slit back and forth. What happens as the slit gets closer and farther from the source? Does changing the color affect this?
- Now set the slit width at 1050 and the barrier location at 2950. Use the target on the detector to compare the amplitudes on each side of the barrier. What happen directly behind the opening versus behind the barrier?
- Click “Show Screen” and “Intensity Graph.” What do you think these represent and are showing?
Now take the information you have observed using this simulator and write your conclusions. How do you think altering factors like wavelength and frequency affect they way we see and hear? How does this help us understand how things like lenses and walls can alter the way we see certain lights and hear certain sounds?
Activity 2:
Part I: Determine the speed of waves in water.
1. Design Your Procedure – What would you do to figure out the speed of waves in water? Describe the steps you would take and the virtual tools you would use to figure this out. You should have a clear, step-by-step description that anyone in the class would be able to follow. (No numbers in this section, just a description.)
2. Collect Your Data – What data did you collect using the procedure you created in #1? How many times did you collect data to be confident in your accuracy? The data should be clearly organized in a way that matches your procedure.
3. Make Your Calculations – What calculations do you need to make on the data you collected? Show the equations you use and your answer for the speed of waves in water. Pay attention to significant digits.
4. Check Your Results – “Doing good science” requires that a researcher’s results can be independently checked by other researchers. Compare your answer for the speed of waves in water with that of a classmate and record both numbers.
Why might your numbers be different?
Should everyone get the same number or is it okay to have different numbers?
What is the percentage difference between your numbers? Is it “significant”?
Part II: Investigate ripple patterns.
5. Play With The Ripple Tank – Observe the different ripple patterns you get with changes to the waves and the ripple tank. For example:
See what happens with one faucet vs two faucets.
Turn the faucets on and off.
Change the frequency and amplitude of the drops.
Add a barrier with one slit or two slits and move the barrier left and right.
Change the width and spacing of the slits in the barrier.
Subscribe to:
Posts (Atom)